

Revenue data engineering

Three reports. Three different numbers

Sales says one thing. Finance says another. The board deck says a third. We build the data layer underneath your CRM so the numbers agree. They stay agreed after we leave.

Trusted by

  • First Agenda
  • Manual
  • McKinsey
  • NHS
  • Pfizer
  • Siemens

The problem

You don't have a reporting problem. You have a data problem.

Dashboards get rebuilt. The numbers still disagree. Here is what that usually looks like.

  1. Two teams, two definitions of the same thing

    Sales counts a deal from the day it is created. Finance counts it from the day it is signed. Both are right. Nobody can reconcile the two, so meetings start with an argument about the number.

  2. The forecast is a spreadsheet

    It lives on one laptop. One person maintains it. When that person is away, the business cannot see its own pipeline.

  3. Nobody trusts the dashboard

    It was wrong once, in a meeting, in front of the board. Now people export to Excel and check by hand. The dashboard is still there. It just is not used.

  4. Every question takes a week

    Simple questions need an analyst, a data pull and three follow-ups. By the time the answer arrives, the decision has been made without it.

Who we work with

One problem, seen in three kinds of work

The pattern is the same each time: the numbers that should agree live in several systems, and each one says something different. We fix the layer underneath so the business can trust one answer.

SaaS revenue numbers live in several places. The CRM has the forecast, billing has what was invoiced, and finance has the board version. Each one is defensible, but they do not always agree.

We turn MRR, churn, expansion and coverage into tested pipeline logic, so monthly reporting starts with the number rather than a reconciliation.

Revenue reporting rebuilt from source systems to dashboard

Pharmaceutical teams need more than a dashboard. Access must be provable, lineage traceable, and a number in a submission must still make sense years later.

We build that control into the model and the pipeline from the start, so review is part of the work rather than a clean-up job at the end.

Pfizer reporting and pipeline work

Ecommerce stacks grow fast: storefront, payments, subscriptions, email and ad platforms, each with its own customer and conversion numbers.

We bring them into one customer model, so cohorts, retention and channel spend can be compared on the same basis.

Reporting rebuilt for a high-growth D2C business

B2B SaaSPipeline, bookings and ARR that match.

SaaS revenue numbers live in several places. The CRM has the forecast, billing has what was invoiced, and finance has the board version. Each one is defensible, but they do not always agree.

We turn MRR, churn, expansion and coverage into tested pipeline logic, so monthly reporting starts with the number rather than a reconciliation.

Revenue reporting rebuilt from source systems to dashboard

PharmaceuticalGoverned analytics that can be explained later.

Pharmaceutical teams need more than a dashboard. Access must be provable, lineage traceable, and a number in a submission must still make sense years later.

We build that control into the model and the pipeline from the start, so review is part of the work rather than a clean-up job at the end.

Pfizer reporting and pipeline work

Ecommerce and D2COne customer view across channels.

Ecommerce stacks grow fast: storefront, payments, subscriptions, email and ad platforms, each with its own customer and conversion numbers.

We bring them into one customer model, so cohorts, retention and channel spend can be compared on the same basis.

Reporting rebuilt for a high-growth D2C business

What we do

Fix the layer underneath, not the screen on top

Most engagements start small and grow. You do not have to buy all of it to begin.

  1. Get the numbers to agree

    One definition per metric, written down, and a model that produces it. Pipeline, bookings, revenue and churn are worked out once and used everywhere.

  2. Build the pipelines that keep them agreeing

    Data moves from your CRM, billing and product systems into a warehouse on a schedule, with tests that fail loudly. Built on dbt, Snowflake and AWS. No manual steps.

  3. Make reporting something people use

    Tableau and Power BI, built around the questions your team really asks. Fewer dashboards, and each one answering something specific.

  4. Hand it over properly

    Documentation, tests and recorded training so your team owns it afterwards. The aim is that you stop needing us. That is not a slogan. It is how the work is scoped.

How an engagement runs

A call

Thirty minutes on the problem. Not a pitch. Sometimes the answer is that you do not need us, or that someone else is a better fit.

Scope and a price

A written plan with a number attached, before any work starts. No open-ended day rates.

Build, in the open

You see progress every day. Nothing lands as a surprise at the end.

Handover

Documentation, training, tempaltes, recordings. Your team runs it. We are there if something breaks.

Where we work

Source systems
Salesforce · HubSpot · Stripe
Warehouse and pipelines
Snowflake · dbt · Airflow · AWS
Reporting
Tableau · Power BI · Sigma

What clients say

About Data Dune

10
Average years of experience
$270k
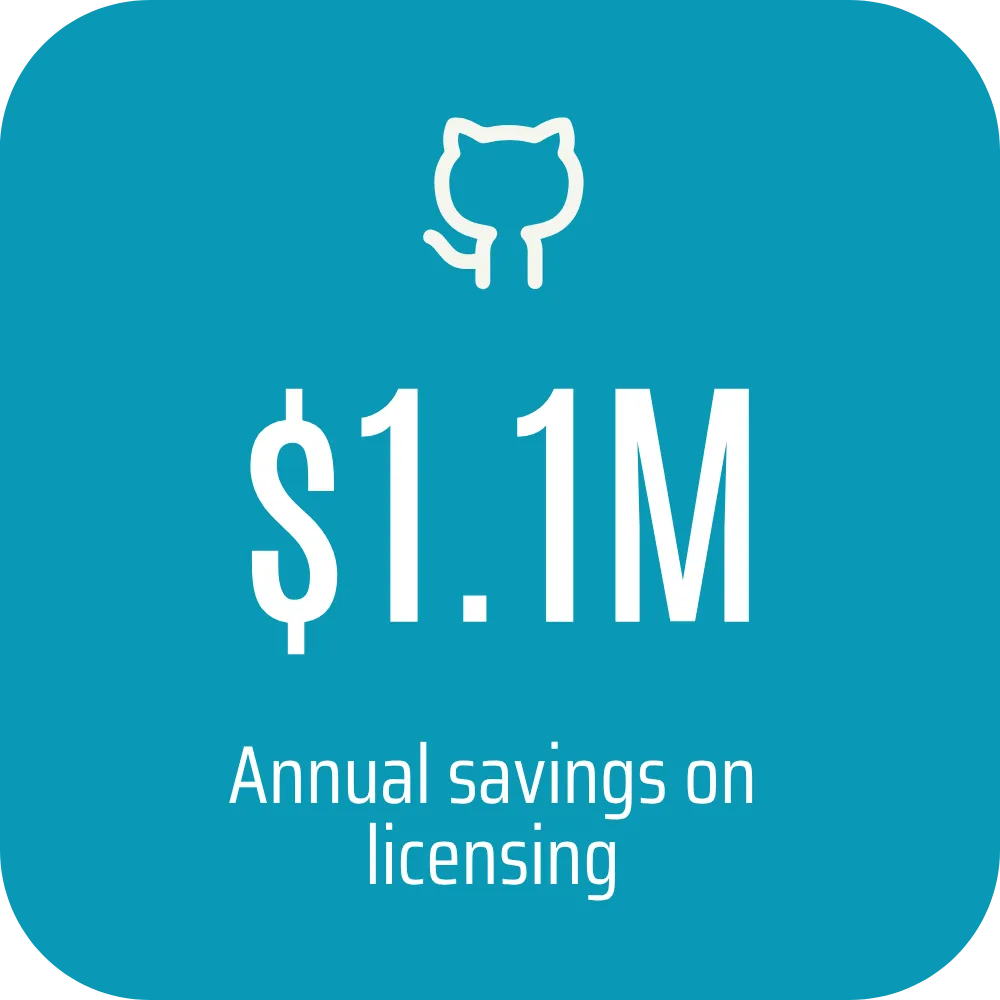
Saved on one licensing review
96%
Delivered within scope
1 week
To your first dashboard

Free workflow

You want a plain-English question box. You do not want AI inventing the number.

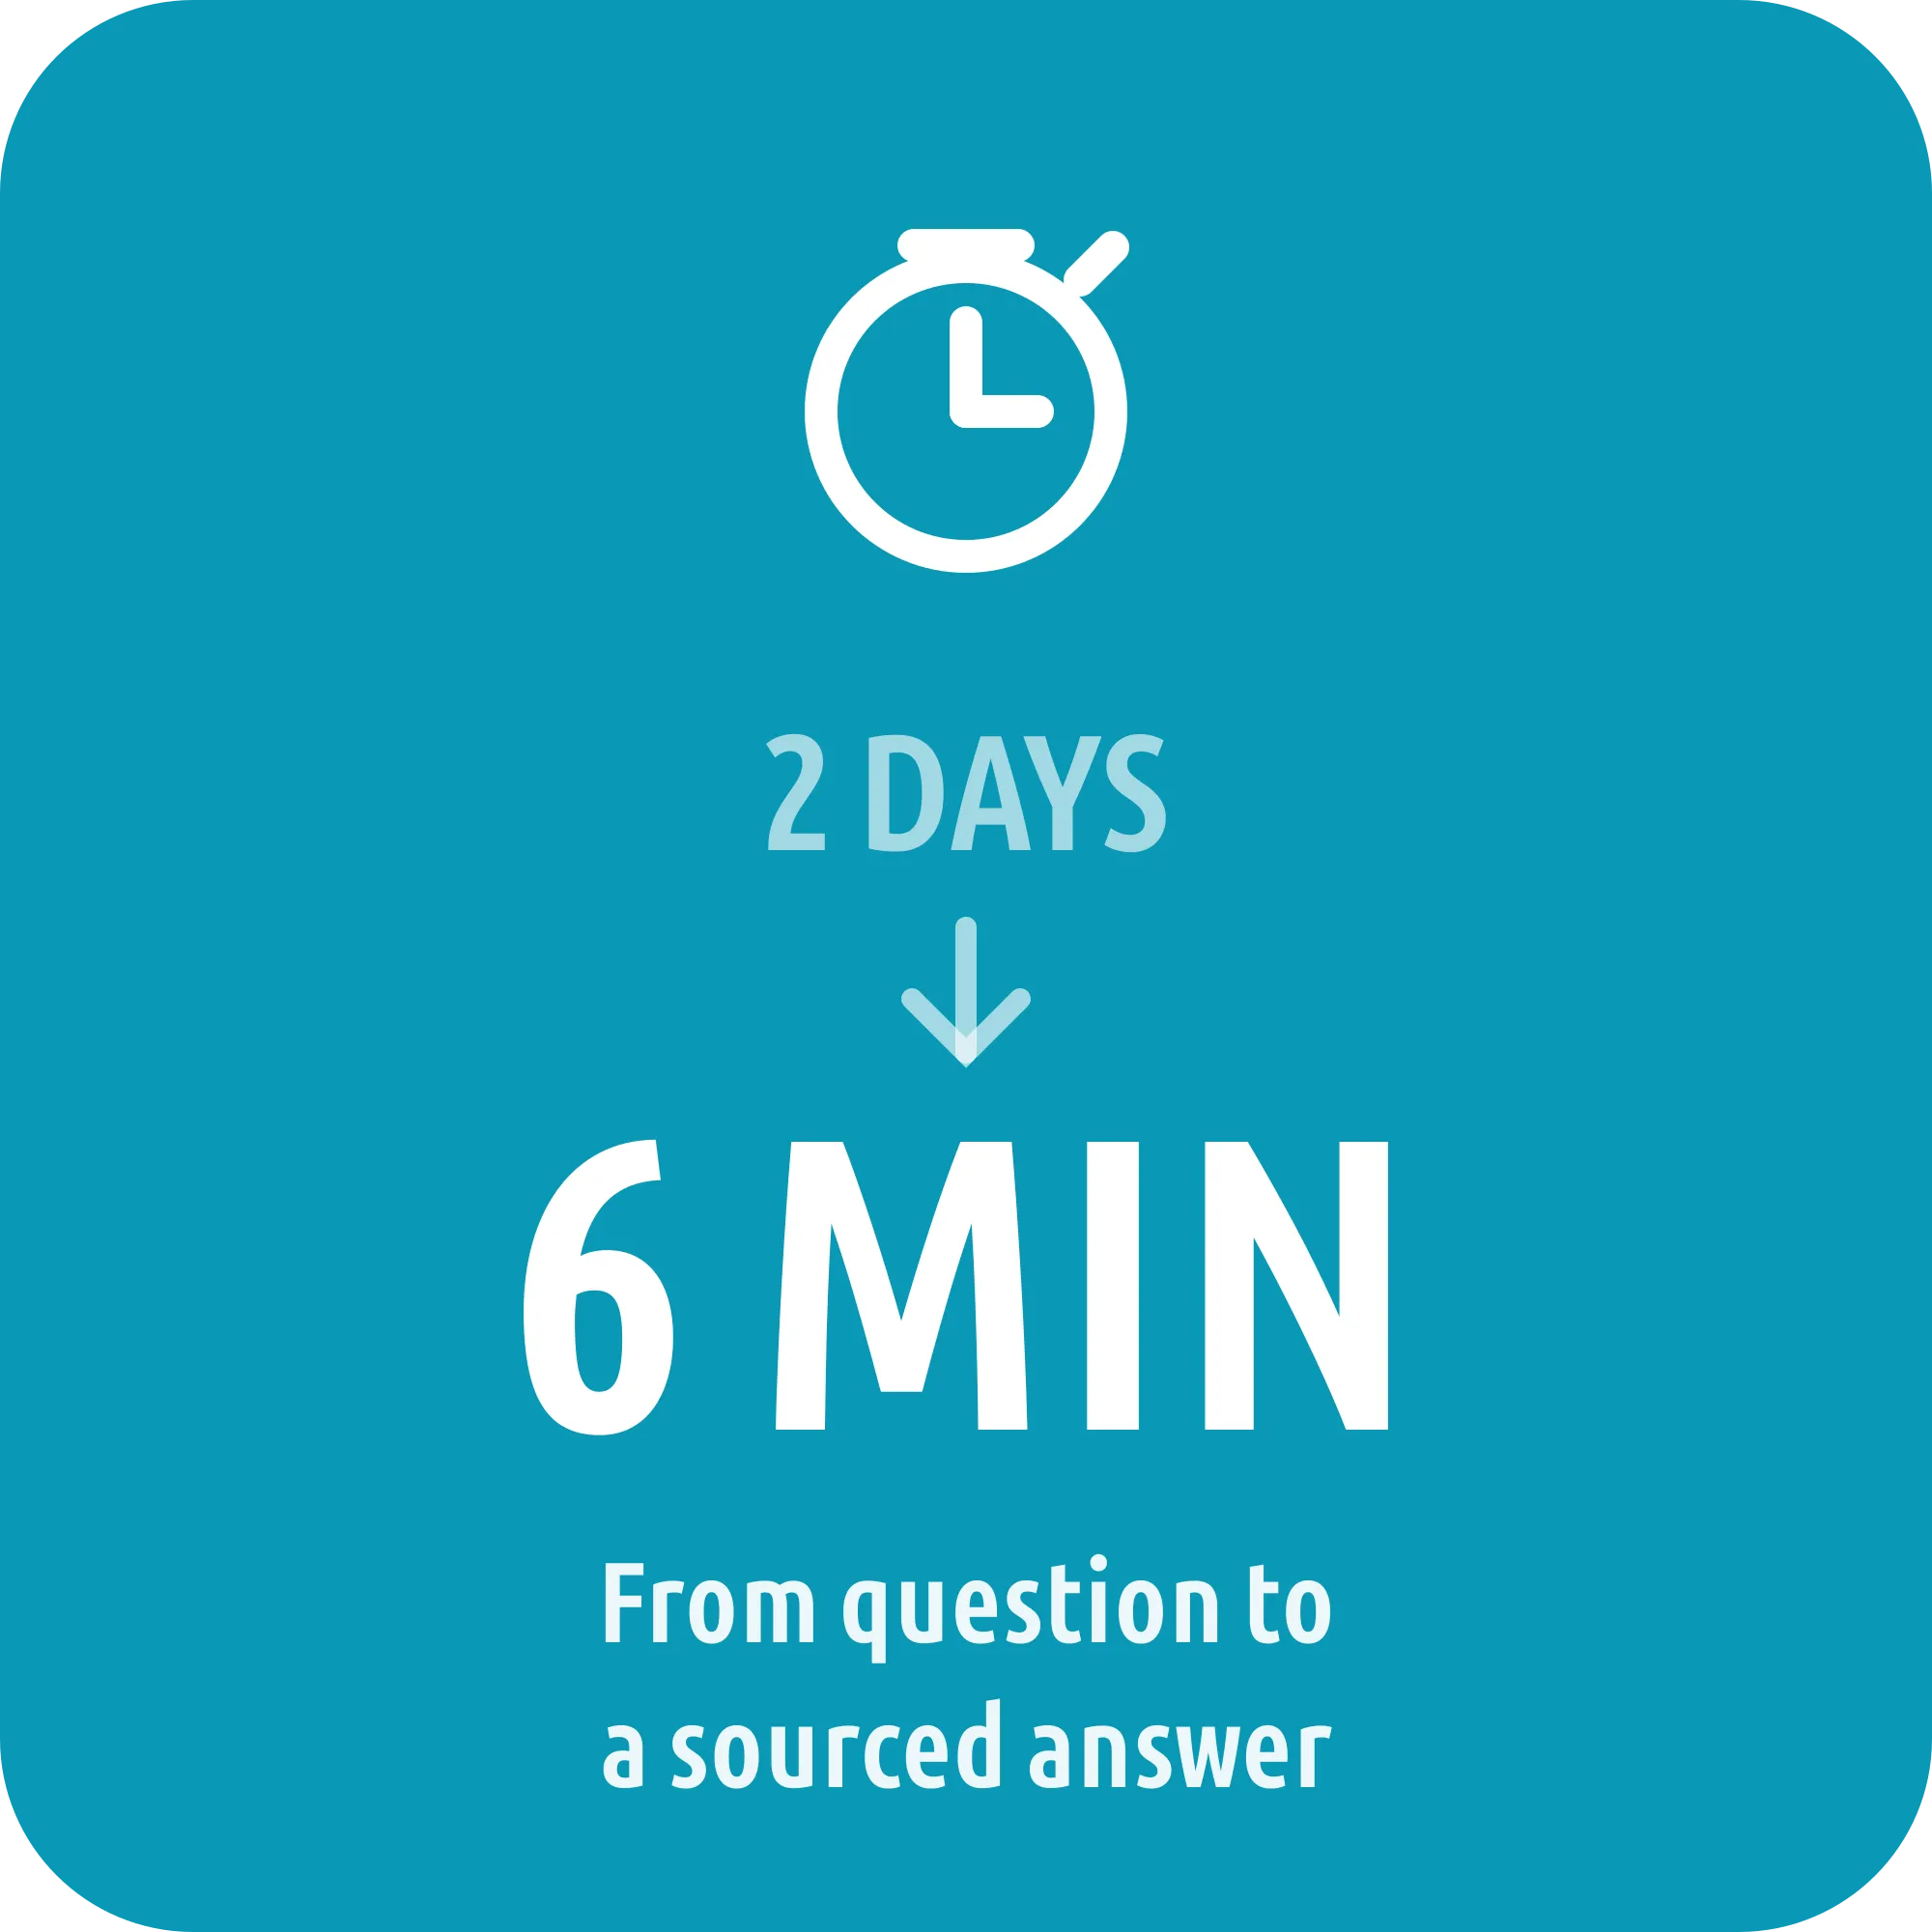
data.Ask asks your Tableau, your database and your documentation the same question, then cross-checks the three answers and shows you where they disagree. It is the quickest audit of the problem this page describes, and it is free to use.

  • Four agents, one sourced answerRAG for your docs, SQL for your numbers, Tableau MCP for your dashboards, and a combiner that surfaces contradictions rather than averaging them away.
  • Running in an afternoonAn n8n workflow and a five-step setup guide, against Tableau Cloud and your own database.
  • Free, and free to keepAuth, row-level security, monitoring and prompts tuned to your business are the paid engagement. The workflow itself is not a trial.

No call required to download it. You can run it in one day. If it shows you something you do not like, that is a good enough reason to talk.

Talk still with a slide titled Why Parallel, Not Sequential and Igor speaking beside it.

A walkthrough from a Tableau Conference talk.

Common questions

Do you work inside our CRM?

Yes, where it is needed. Salesforce and HubSpot objects, fields and reports are all fair game. Our specialism is the layer below, and that is usually where the problem turns out to be.

We only need a few dashboards. Too small?

No. That is the usual starting point, and it tends to surface the questions worth solving next.

Can you work in a regulated environment?

Yes. Regulated delivery is a large part of our history, including work inside Pfizer teams.

What does it cost?

It is scoped against the value it returns, not sold as a package. You get a number before the work starts.

Next step

Which number do you not trust?

Bring the report nobody trusts. We will tell you what is actually wrong underneath it.

Thirty minutes, straight to the problem. No deck, no pitch, and a written summary afterwards either way.