
AI analytics layer
An AI Analytics Layer a Data Team Was Willing to Put Its Name On
A mid-size SaaS company wanted AI on top of its analytics instead of a bigger BI team. Deploying d.Ask took days. The rest of the three weeks went on the part that decides whether anyone trusts it, reconciling the definitions and logic underneath so every answer could be traced back to a source.
- B2B SaaS
- AI analytics layer
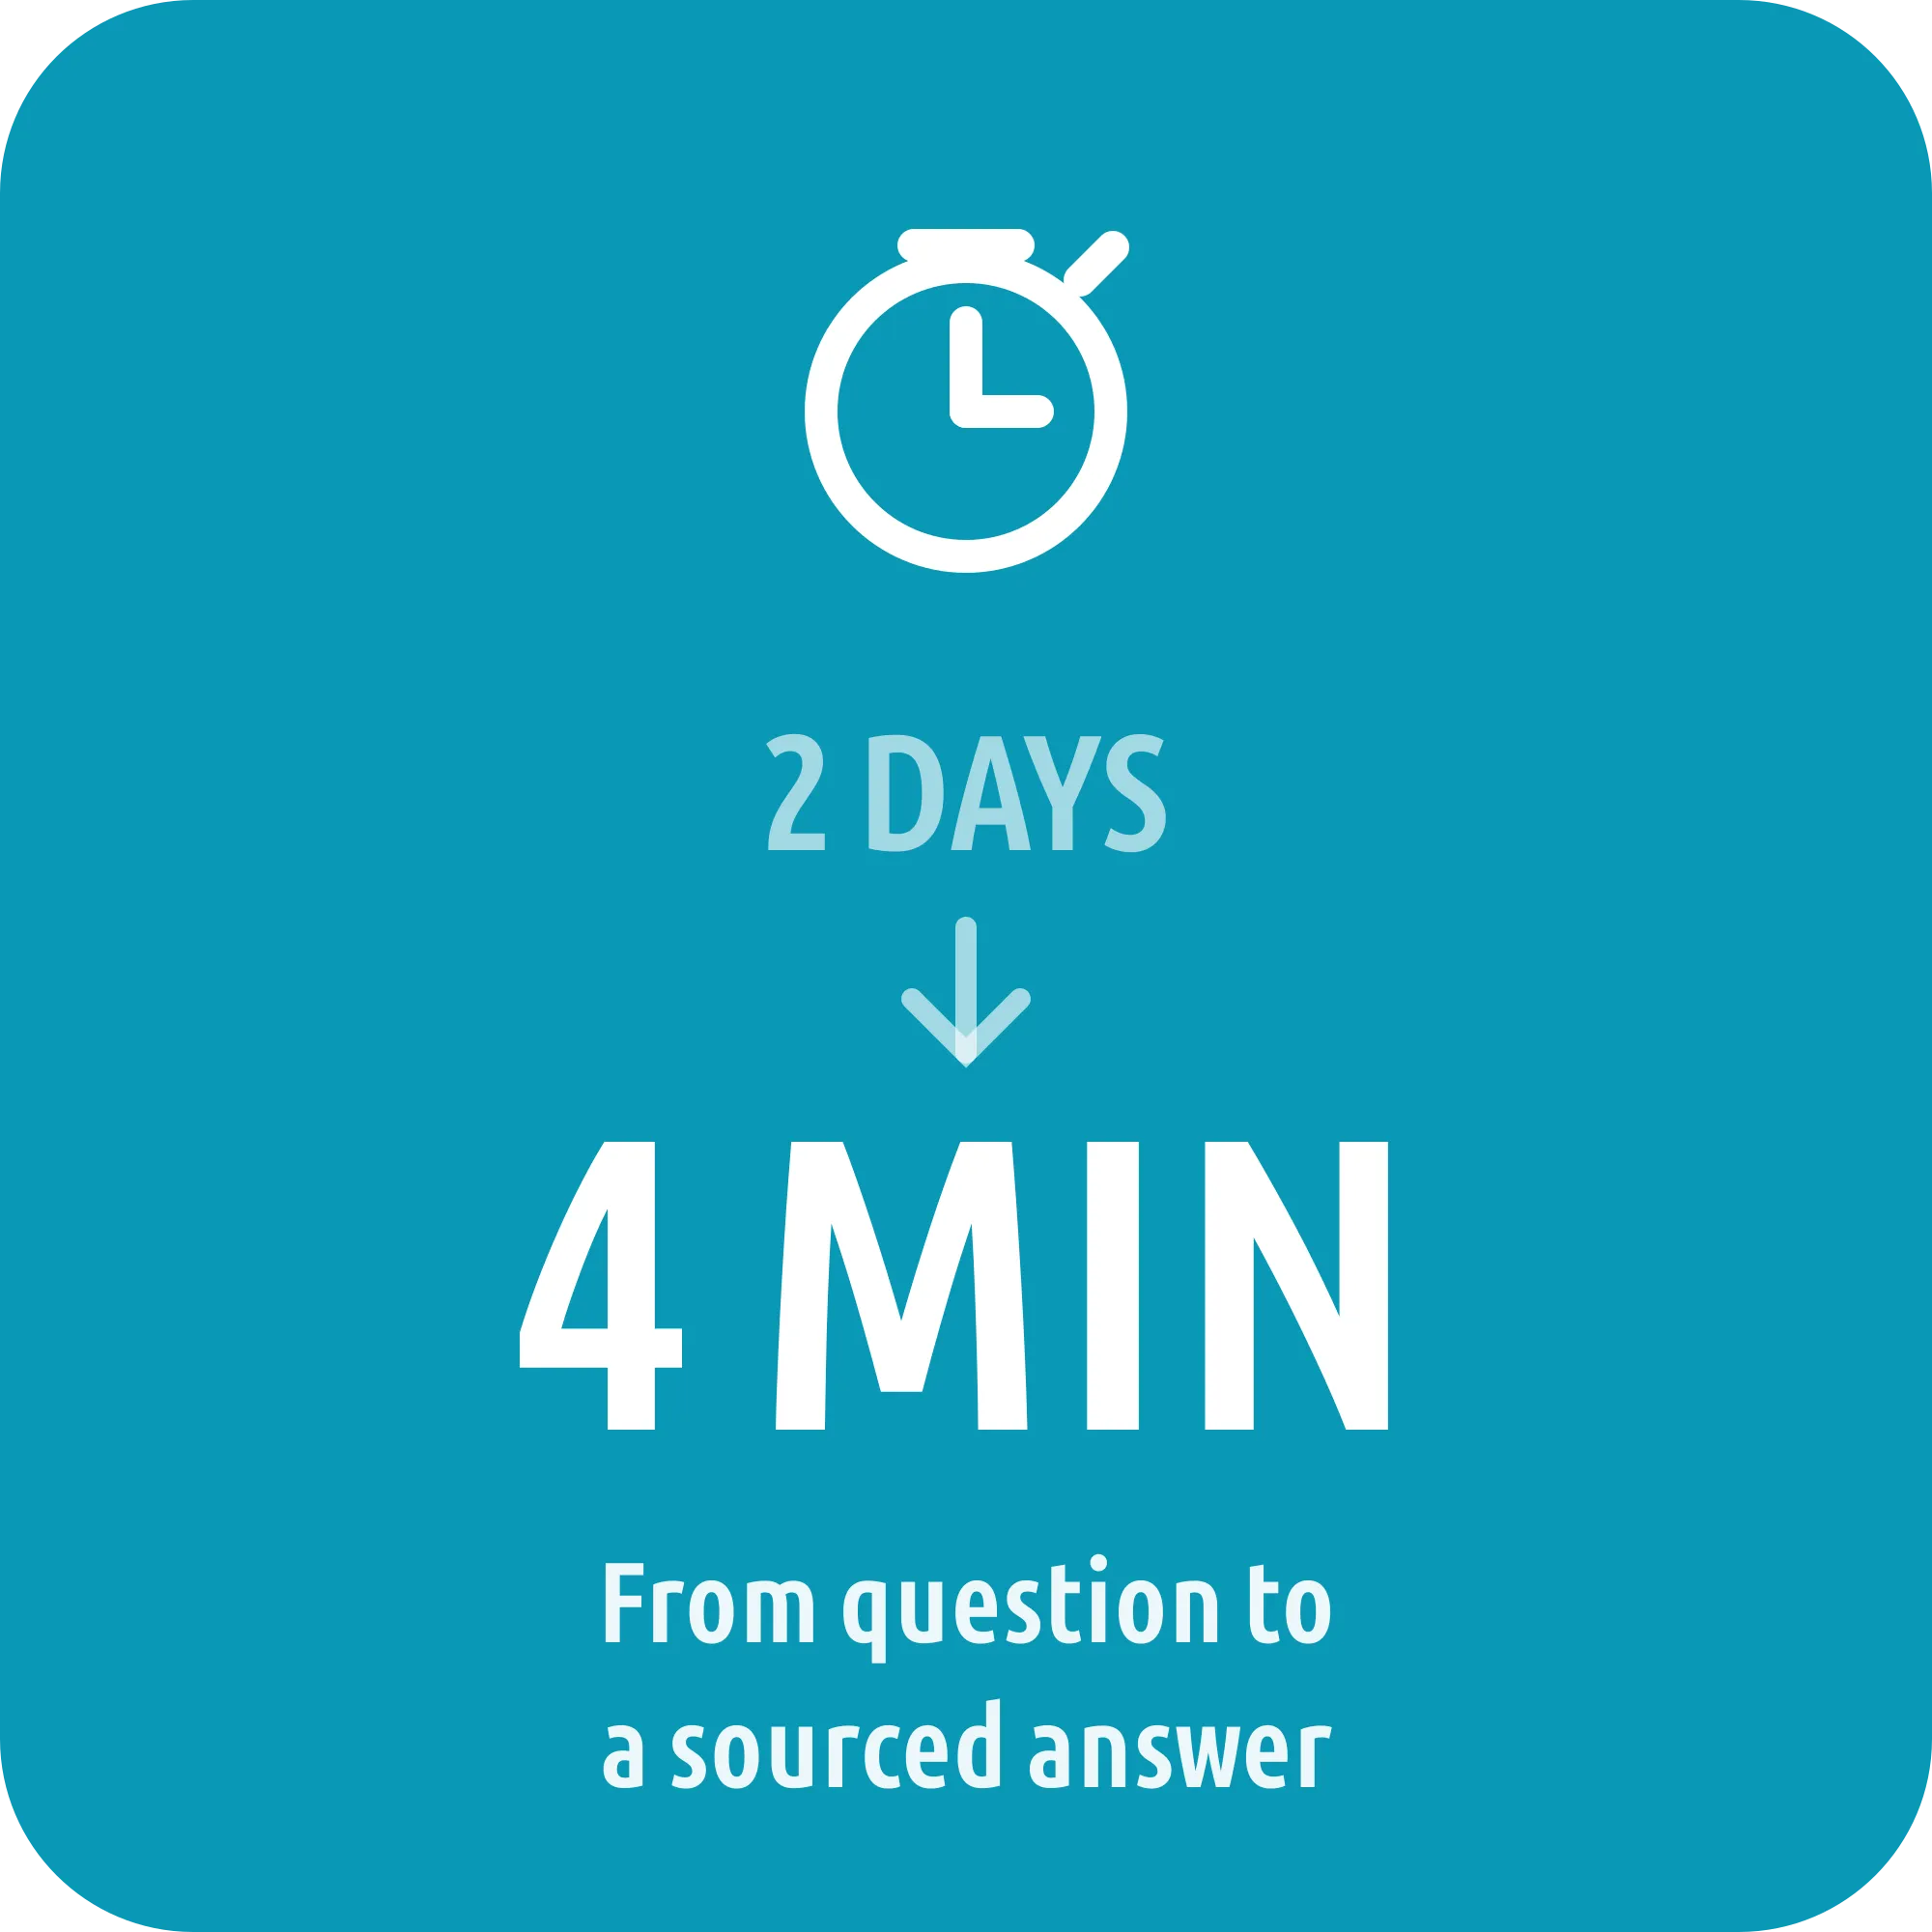
- 2 days to 4 min
Challenge
A four-hundred-person SaaS business was about to grow its BI team again, and the work the new hires would inherit was lookups rather than analysis. Paying more people to answer what-is-the-number questions was the expensive option. The quiet one was remaining a data-rich company getting nothing back from AI while competitors found something. Pointing an assistant at the warehouse was not safe yet, though. Churn was defined one way in the documentation, calculated another way in a Tableau calculated field, and a third way in the warehouse, and several tables had not been reconciled in months. An assistant given those sources does not decline to answer. It answers fluently, confidently and sometimes wrongly, and because asking has become instant and free, a wrong number travels further in an afternoon than any analyst can chase in a week.
Solution
Deployed d.Ask across four sources: Tableau Cloud for live dashboard metadata and calculated field formulas, Snowflake and Postgres for the numbers, and their GitHub documentation for definitions and context. HubSpot and Asana were deliberately left out, because a layer is only as credible as its least trustworthy source and connecting two we could not yet vouch for would have put every answer it gave in doubt. Most of the engagement was calibration rather than installation. We reconciled the competing definitions of each core metric and agreed which one was authoritative, corrected the logic that disagreed with it, and set the precedence the combining agent applies: the warehouse wins on numbers, the documentation wins on context, Tableau wins on what a dashboard is actually doing. Where sources still genuinely disagreed, we made the layer say so and cite both rather than quietly pick one and sound certain.
Results
Questions that used to take about two days came back in about four minutes, with their sources attached. Analysts stopped running a lookup service and went back to analysis. The result that mattered most to the data team was not the speed. Because any answer can be traced to where it came from, they could open the layer to the business without personally underwriting every figure that ended up in a board pack, and a number in a deck can be checked in seconds instead of rebuilt from scratch. Three weeks start to finish, and they finished with a working layer, a documented set of authoritative metric definitions that outlives it, and a clear path for the next AI project.
Next step
Recognise this pattern?
It is rarely the report. It is usually what feeds it. That is a fixable problem.
Thirty minutes, straight to the problem. No deck, no pitch, and a written summary afterwards either way.